Explore
Featured
Recent
Articles
Topics
Login
Upload
Featured
Recent
Articles
Topics
Login
Upload
Search Results for 'graph graphing'
graph graphing published presentations and documents on DocSlides.
Graphing Graphing Background
by singh
Scientist interpret tables, graphs, and diagrams t...
Graphing With Excel 2010
by briana-ranney
University of Michigan – Dearborn Science Learn...
GRAPHING VELOCITY How do you see velocity on a graph?
by jane-oiler
You can see it on a. . . position time . graph...
Graphing Calculator Lesson 1: Graphing Lines and Finding Intercepts
by test
This entire power point will be posted on the web...
Graphing Systems of Equations
by min-jolicoeur
Algebra 1: Unit 7. Graphing linear equations. Gra...
Graphing Motion How can you find the speed from a distance-time graph?
by phoebe-click
. Slope = rise ÷ run. Speed = distance ÷ time....
System of Inequalities
by olivia-moreira
Alg. 2. Mr. Carpenter. BEWARE!!!… . QUIZ . AF...
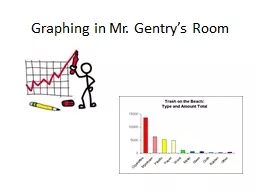
Graphing in Mr. Gentry’s Room
by cheryl-pisano
Why graph?. Visual representation of data. We plo...
2-8: Graphing Inequalities in the Coordinate Plane
by tatyana-admore
Algebra 2 CP. Graphing Inequalities in the Coordi...
Math Refresher Unit II:
by liane-varnes
Graphing, Exponents, and Logs. RPAD Welcome Week ...
Graphing Linear Equations
by lindy-dunigan
By: Christine Berg. Edited By: VTHamilton. Linear...
Solve Linear Systems by Graphing
by trish-goza
Objectives:. To solve a system of linear equation...
Graphing skills Graphs A graph shows trends in measurements even more clearly than tables do.
by alexa-scheidler
The type of graph you draw depends on the types o...
Graph limit theory: an overview
by faustina-dinatale
L. á. szl. ó. . Lov. á. sz. . Eötvös. . L...
Grasping Graphing
by calandra-battersby
Solutions to Understanding . and Presenting Data....
UNIT THREE
by danika-pritchard
DAY SEVEN. Linear Inequalities. OBJ: Graph a line...
Algebra I
by danika-pritchard
Chapter 8/9 Notes. Part II. 8-5, 8-6, 8-7, 9-2, 9...
Piecewise Functions
by cheryl-pisano
Objective: Students will understand what a piece...
Graphing Piecewise Functions
by alida-meadow
Example.. Graph the piecewise. defined function. ...
Sect. 2-3 Graphing Polynomial Functions
by debby-jeon
Objectives: Identify Polynomial functions. Determ...
Graphing the Derivative, Applications
by lindy-dunigan
Section 3.1b. Remember, that in . graphical terms...
Test #3 Review
by trish-goza
Test will cover Modules 12, 13, 14, and 15. Remem...
Objective
by calandra-battersby
I Can: . solve systems of equations by graphing.....
Graphing Using
by debby-jeon
x . & y Intercepts. Algebra Honors. Finding t...
I can graph!
by karlyn-bohler
My Name is . Kinder Graphing. Graph the Apples. �...
CHAPTER 5:
by briana-ranney
Exponential and Logarithmic Functions and Equati...
Suck It Up!
by tawny-fly
Understanding photosynthesis through quantitative...
Graphing A Function Rule
by kittie-lecroy
Lesson 4-4. To graph a function rule:. Choose 3-5...
Graphing Data Using excel
by lindy-dunigan
2. nd. Grade. Overview. Excel Project- Graphing....
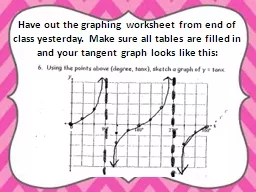
Have out the graphing worksheet from end of class yesterday
by myesha-ticknor
Goals for today:. Graph sine, cosine and tangent ...
Collect and Analyze Data (GRAPHING)
by layla
What should be on every graph?. THREE TITLES. !. ...
Warm Up Using your unit circle find each value:
by fauna
Sin 0°= . Sin . = . Sin . π. =. Sin . =. Sin ...
Solve Linear Systems by Graphing
by karlyn-bohler
A “System” is a . set of equations.. A . Line...
3.7 Graphing Absolute Value Functions
by sherrill-nordquist
How do the value of . a. , . h. , and . k. , affe...
Algebra unit 4: Graphs of equations and functions
by aaron
Unit 4 PowerPoint. The coordinate Plane. The coor...
3-5 Graphs in Three Dimensions
by jane-oiler
Objective: To graph points and equations in three...
Graphing Station Lab Summary of Stations
by test
1. English Usage-- Assess a Graph [tadpoles]. 2...
Graphing Picture and Bar Graphs
by ellena-manuel
By . Giovanna Giurdanella. November 29. th. , 201...
Inequalities Graphing and solving
by tatyana-admore
Inequality Symbols. < . > . ...
Review Graphing Linear Equations
by giovanna-bartolotta
A review of sections 4.2, 4.3, and 4.5 . Mike . H...
Load More...